Many historically ‘redlined’ California communities have higher COVID-19 incidence and mortality

One of the legacies of “redlining” may be higher incidence and mortality rates of COVID-19 affecting the largely minority and poor residents of these neighborhoods, according to research published at the ATS 2022 international conference. Redlining is a Great Depression-era federal policy in which neighborhoods with large ethnic/racial minority groups were denied federal resources.
“Our study demonstrates that where you live matters,” said presenting author Ernesto Casillas, MD, pulmonary & critical care medicine fellow, University of California, San Francisco (UCSF). “Prior research has already shown that redlining is associated with worse outcomes for asthma, birth rates, and cancer.”
He added, “When the pandemic started, early epidemiologic data showed that our society’s most vulnerable groups were being disproportionately affected by COVID-19. To our knowledge, no prior studies have tried to assess the role of redlining on health outcomes for COVID-19. Our study sought to address this important gap.”
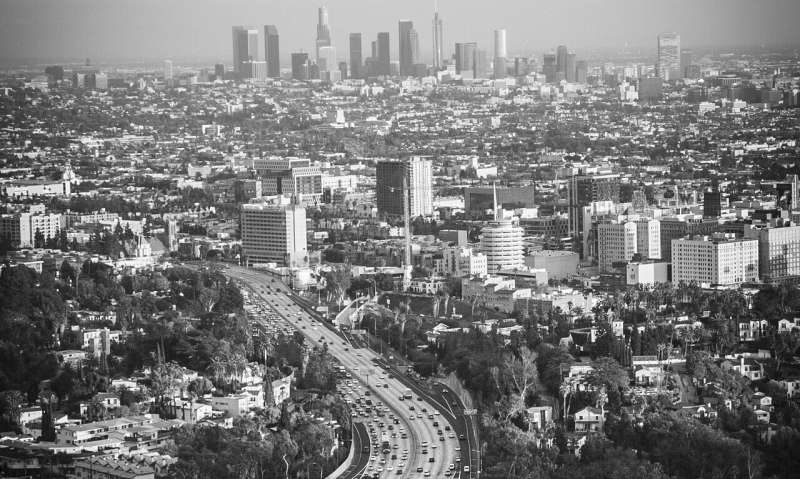
Residential redlining was a racist mortgage-lending policy instituted by the federal Home Owners Loan Corporation (HOLC) that denied financial relief to home owners at risk of losing their homes due to the Great Depression. The HOLC literally drew red lines around neighborhoods and deemed them less desirable because of the racial and ethnic composition of these neighborhoods. These communities are now vulnerable to poverty, crime, and increased rates of many diseases. Examples of redlined neighborhoods in California include South and East Los Angeles and areas surrounding San Francisco’s Tenderloin and Mission District.
In this study, Dr. Casillas and UCSF colleagues examined census tract data on COVID-19 cases and deaths reported to the California Department of Public Health from January 2020 to August 2021. San Francisco, Oakland, Los Angeles, San Jose, Sacramento, Stockton, Fresno, and San Diego were included in the study. The researchers then used digital versions of HOLC maps to assign each census tract an HOLC designated risk grade (A-D, with “D” representing the census tracts in historically redlined neighborhoods). They then performed statistical analyses to evaluate the association between HOLC risk grade and COVID-19 case and death rates, adjusting for percent female, age, comorbidities and overcrowding. The Healthy Places Index (HPI), a combined measure of community well-being and the Index of Concentration at the Extremes (ICE), a measure of social separation of economically deprived and privileged social groups, were used in separate analyses to adjust for aggregate measures of social conditions.
When results were not adjusted in any of the ways described above, they showed that as HOLC grade worsened, the rates of COVID-19 cases and deaths increased. For tracts with the worse HOLC grade, D (redlined), the incidence rate ratio (RR) was 3.34 (that is, 3.34 times higher), compared to the best graded tracts. The RR for death was 2.27. In adjusted models, the incidence RR for COVID-19 cases was 1.28, and the RR for death was 1.62. When adjusting for HPI score, the incidence RR was 1.21 and the RR for death was 1.56. Similarly, when adjusting for ICE, the RR for COVID-19 cases was 1.14 and the RR for deaths was 1.38.
Source: Read Full Article


